

When it comes to employee wellbeing, the causes of stress and anxiety aren’t limited to the workplace itself, but also to factors outside of work, such as financial security and personal health.
We researched data across a variety of different factors to show the reality of workplace wellbeing in the different regions of the UK, looking at averages to create a picture of work intensity, financial security and emotional and physical health. We then ranked these in order of best to worst and created a final score to depict how each of these factors has an impact on workplace wellbeing.
The CIPD report on employee wellbeing found that the most common causes of stress at work were:
- Workloads and volume of work (60%)
- Non-work factors- relationships/family (27%)
- Management style (26%)
- Non-work factors- personal illness/health issue (25%)
- COVID-related anxiety eg. fear of contagion in the workplace/commute (24%)
- New work-related demands or challenges due to homeworking as a result of COVID-19 (23%)
- Poor work-life balance due to homeworking as a result of COVID-19 (22%)
- Pressure to meet targets and/or deadlines (20%)
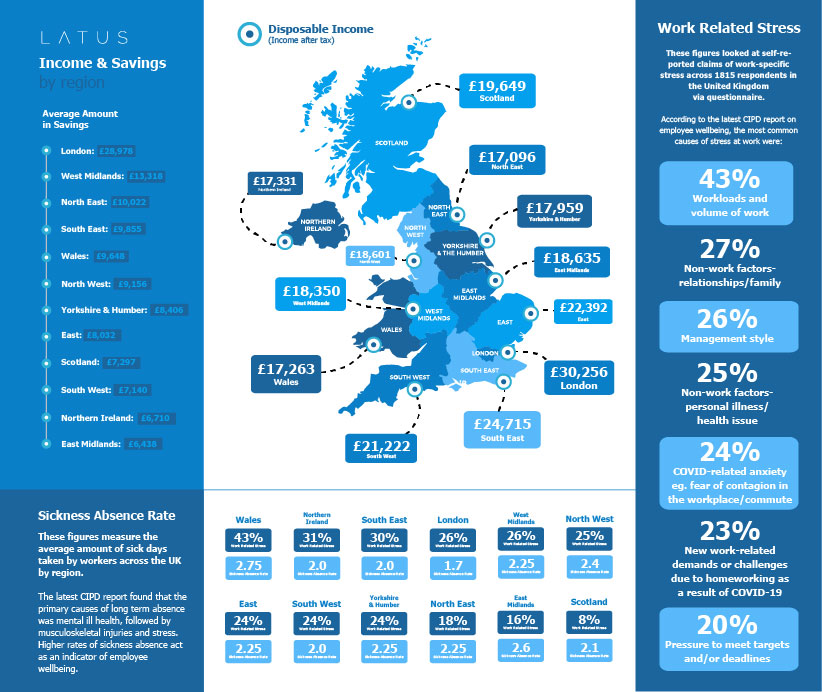
This shows that whilst work-specific stress does play a major role, there are also a variety of factors that affect employees’ day to day wellbeing.The unranked data can be found below:
| Region | Percentage of people living in relative low income after housing costs | Average salary (£) | Basic hours worked | Overtime hours worked (paid) | Overtime hours worked (unpaid, where completed) | Alcohol, tob, narcos spend | Work-related stress | Sickness absence rate | Percentage of remote workers | Disposable income (income after tax) | Quality of environment rating | Average amount in savings |
| London | 27% | 39,716 | 37.4 | 3.4 | 8.1 | 11 | 26% | 1.7 | 18.90% | 30,256 | 6.5 | 28,978.40 |
| South East | 19% | 32,810 | 37.5 | 3.2 | 7.4 | 12.7 | 30% | 2 | 20.50% | 24,715 | 7 | 9,855.55 |
| Scotland | 19% | 31,672 | 37.4 | 3.2 | 7.7 | 14.9 | 8% | 2.1 | 14.50% | 19,649 | 8.2 | 7,297.19 |
| East | 19% | 30,867 | 37.5 | 3.8 | 7.1 | 13.3 | 24% | 2.25 | 18.60% | 22,392 | 6.1 | 8,032.85 |
| West Midlands | 25% | 30,000 | 37.5 | 4 | 7.5 | 11.9 | 26% | 2.25 | 16.70% | 18,350 | 8.1 | 13,318.35 |
| North West | 22% | 29,529 | 37.5 | 3.5 | 7.4 | 13.5 | 25% | 2.4 | 14.80% | 18,601 | 6.9 | 9,156.79 |
| Northern Ireland | 18% | 29,109 | 37.5 | 4.1 | 7.6 | 14.6 | 31% | 2 | 11.70% | 17,331 | 7.1 | 6,710 |
| South West | 19% | 29,080 | 37.5 | 3.1 | 7.2 | 12.6 | 24% | 2 | 20.20% | 21,222 | 8.5 | 7,140.18 |
| Yorkshire and the Humber | 24% | 28,808 | 37.5 | 4.1 | 7.7 | 12.8 | 24% | 2.25 | 16.20% | 17,959 | 8.1 | 8,406.60 |
| Wales | 23% | 28,506 | 37.4 | 4 | 7.1 | 11.8 | 43% | 2.75 | 17.20% | 17,263 | 6.9 | 9648.91 |
| East Midlands | 20% | 28,416 | 37.5 | 3.7 | 8.2 | 13 | 16% | 2.6 | 16.60% | 18,635 | 8.3 | 6,438.49 |
| North East | 25% | 27,515 | 37.4 | 3.6 | 7.5 | 13.4 | 18% | 2.25 | 13.20% | 17,096 | 8.6 | 10,022.58 |
Scale
12: the worst in the UK
Above 10: extremely poor
8-9: poor
The worst to best when it comes to workplace wellbeing
Overview: which areas did they score poorly in?
1. The North West
Topping the list when it comes to poor workplace wellbeing is the North West, achieving extremely poor in terms of sickness absence rate, environmental problems and alcohol, tabacco and narcotics spend. They also scored poorly when it came to flexibility around remote working and paid overtime.
2. The North East
It’s perhaps unsurprising that both Northern regions top the list when it comes to poor workplace wellbeing, as they’re often associated with deprivation and poor levels of health and wellbeing generally. They scored the worst for average income, disposable income and extremely poorly in terms of relative low income after housing and flexibility in terms of remote working. They also scored poorly on sickness absence rate and alcohol, tobacco and narcotics spend.
3. Yorkshire and the Humber
Another region associated with high levels of deprivation, Yorkshire and the Humber scored extremely poorly when it came to average salary, basic hours worked and unpaid overtime, and poorly on relative low income after housing cost, disposable income and sickness absence rate.
4. East Midlands
When it came to the East Midlands, it appears the main problem is work intensity and financial security. Many workers faced high average working hours including amounts of unpaid overtime, whilst being compensated poorly in comparison to UK averages. They scored the worst for basic hours worked and unpaid overtime and extremely poorly on sickness absence rate and average salary.
5. Northern Ireland
Northern Ireland scored poorly across several factors. They scored the worst when it came to flexibility around remote working and extremely poorly in terms of average savings, work-related stress and alcohol, tobacco and narcotics spend and disposable income. They scored poorly when it came to basic hours worked and unpaid overtime. This shows that they experience high levels of workplace intensity without being fairly compensated in comparison to UK averages.
6. Wales
Wales featured with poor scores across several factors, ranging from financial security to physical and mental health. They scored the worst for work-related stress and sickness absence rate, and extremely poorly when it came to disposable income and the environment. They also scored poorly on average salary and relative low income after housing cost.
7. Scotland
According to the data, Scotland’s main issues were in work intensity and physical and emotional health. They scored the worst in alcohol, tobacco and narcotics spend, and extremely poorly when it came to paid overtime and flexibility around remote working. They also scored poorly on basic hours worked and unpaid overtime as well as average savings.
8. West Midlands
The primary factors affecting the West Midlands appear to be financial security, scoring extremely poorly when it came to relative low income after housing cost and poorly in terms of disposable income. And in terms of physical and mental health, as they scored poorly in terms of work-related stress and sickness absence.
9. East
The key issues in the East of England were in the sector of physical and emotional health, they scored the worst in terms of the environment, and poorly when it came to sickness absence rate, and and alcohol, tobacco and narcotics spend. They also scored poorly when it came to average amount of savings, however did well in terms of other financial security factors.
10. South West
The South West is primarily affected by financial security. They scored the worst for paid overtime, extremely poorly for average savings and poorly for average salary, however this is compensated by their good scores for flexibility around remote working, as well as moderate scores in terms of disposable income.
11. London
On average, Londoners tended to work some of the longest basic hours, coming second after the East Midlands. They scored the worst for relative low income after housing cost, extremely poorly for basic hours worked and unpaid overtime and the environment, and poorly for work-related stress.
12. South East
The South East ultimately came out on top when examining factors affecting workplace wellbeing. And while they scored extremely poorly for paid overtime and work-related stress, and poorly in terms of the environment, they saw good scores in flexibility around remote working, and average salary and disposable income.
See the other scores in further detail below:
| Work intensity | Physical/mental health | Financial security | Total score | ||||||||||
| Ranking (worst to best) | Region | Basic hours worked + unpaid overtime score | Paid overtime | Flexibility score (remote work) | Work-related stress | Sickness absence rate | Environment | Alcohol/tobacco/narco spend | Relative low income after housing cost | Average salary | Disposable income | Average savings | |
| 1 | North West | 6 | 8 | 9 | 7 | 10 | 10 | 10 | 7 | 6 | 7 | 6.00 | 86.00 |
| 2 | North East | 6 | 7 | 11 | 3 | 9 | 1 | 9 | 11 | 12 | 12 | 3.00 | 84.00 |
| 3 | Yorkshire and the Humber | 10 | 2 | 8 | 6 | 9 | 6 | 6 | 9 | 11 | 9 | 7.00 | 83.00 |
| 4 | East Midlands | 12 | 6 | 7 | 2 | 11 | 3 | 7 | 6 | 10 | 6 | 12.00 | 82.00 |
| 5 | Northern Ireland | 9 | 2 | 12 | 11 | 4 | 2 | 11 | 1 | 7 | 10 | 11.00 | 80.00 |
| 6 | Wales | 1 | 4 | 5 | 12 | 12 | 10 | 2 | 8 | 9 | 11 | 5.00 | 79.00 |
| 7 | Scotland | 9 | 11 | 10 | 1 | 5 | 4 | 12 | 5 | 3 | 5 | 9.00 | 74.00 |
| 8 | West Midlands | 7 | 4 | 6 | 9 | 9 | 6 | 3 | 11 | 5 | 8 | 2.00 | 70.00 |
| 9 | East | 2 | 5 | 4 | 6 | 9 | 12 | 8 | 5 | 4 | 3 | 8 | 66 |
| 10 | South West | 3 | 12 | 2 | 6 | 4 | 7 | 4 | 5 | 8 | 4 | 10.00 | 65.00 |
| 11 | London | 11 | 9 | 3 | 9 | 1 | 11 | 1 | 12 | 1 | 1 | 1.00 | 60.00 |
| 12 | South East | 6 | 11 | 1 | 10 | 4 | 8 | 5 | 5 | 2 | 2 | 4 | 58 |
Data references
“Average household income, UK: financial year ending 2021.” Office for National Statistics, 28 March 2022, https://www.ons.gov.uk/peoplepopulationandcommunity/personalandhouseholdfinances/incomeandwealth/bulletins/householddisposableincomeandinequality/financialyearending2021. Accessed 14 May 2022.
“Average savings by age in the UK (2022).” Raisin UK, 24 March 2020, https://www.raisin.co.uk/newsroom/savings/better-saving-money/. Accessed 12 May 2022.
Baron, Christof. “• Remote work in the UK.” Statista, https://www.statista.com/study/73496/remote-working-in-the-uk/. Accessed 12 May 2022.
CIPD, and Simply Health. “Health and Wellbeing at Work 2022.” www.CIPD.co.uk, 2022, https://www.cipd.co.uk/Images/health-wellbeing-work-report-2022_tcm18-108440.pdf. Accessed 24 April 2022.
Clark, D. “• Full-time annual salary in the UK 2021, by region.” Statista, 16 November 2021, https://www.statista.com/statistics/416139/full-time-annual-salary-in-the-uk-by-region/. Accessed 11 May 2022.
Clark, D. “• Overtime: paid hours worked, by age and gender 2020.” Statista, 25 March 2022, https://www.statista.com/statistics/800773/overtime-paid-hours-worked-in-the-uk/. Accessed 11 May 2022.
Clark, D. “• Regional weekly alcohol expenditure (UK) 2018.” Statista, 27 August 2020, https://www.statista.com/statistics/379937/average-weekly-alcohol-tobacco-narcotics-expenditure-england-uk-region/. Accessed 11 May 2022.
Clark, D. “• Working from home rate UK 2020, by region.” Statista, 28 May 2021, https://www.statista.com/statistics/879152/-home-workers-by-region-in-the-united-kingdom-uk/. Accessed 11 May 2022.
Francis, Brigid. “Poverty in the UK: statistics – House of Commons Library.” Commons Library, 13 April 2022, https://commonslibrary.parliament.uk/research-briefings/sn07096/. Accessed 23 May 2022.
Jaganmohan, Madhumitha. “• UK: Quality of environment rating 2016.” Statista, https://www.statista.com/statistics/320366/united-kingdom-uk-rating-environment-quality/. Accessed 14 May 2022.
McCulloch, Adam. “Low number of sick days in UK a sign of ‘outdated legacy attitudes.’” Personnel Today, 25 November 2021, https://www.personneltoday.com/hr/low-number-of-sick-days-in-uk-a-sign-of-outdated-legacy-attitudes/. Accessed 11 May 2022.
“Regional gross disposable household income, UK: 1997 to 2019.” Office for National Statistics, 14 October 2021, https://www.ons.gov.uk/economy/regionalaccounts/grossdisposablehouseholdincome/bulletins/regionalgrossdisposablehouseholdincomegdhi/1997to2019. Accessed 11 May 2022.
“Sickness absence in the UK labour market: 2021.” Sickness absence in the UK labour market – Office for National Statistics, 29 April 2022, https://www.ons.gov.uk/employmentandlabourmarket/peopleinwork/labourproductivity/articles/sicknessabsenceinthelabourmarket/2021. Accessed 12 May 2022.
“UK workers put in £27 billion worth of unpaid overtime during the last year – TUC analysis | TUC.” Trades Union Congress, 25 February 2022, https://www.tuc.org.uk/news/uk-workers-put-ps27-billion-worth-unpaid-overtime-during-last-year-tuc-analysis. Accessed 11 May 2022.
“Work-related stress, anxiety or depression statistics in Great Britain, 2021.” HSE, 16 December 2021, https://www.hse.gov.uk/statistics/causdis/stress.pdf. Accessed 12 May 2022.